ONS Retail Sales May 2025
- Retail sales (value, non-seasonally adjusted, exc. fuel) dipped 0.1% year-on-year (YoY) in May according to the latest ONS data. It compares to a 1.9% rise a year earlier.
- In volume terms (non-seasonally adjusted, exc. fuel), retail sales declined by 1.3% YoY in May. It compares to a soft 0.7% increase a year ago.
- It should be noted that ONS figures are based on a sample of some 5,000 retailers and are subject to revisions.
Retail sales value and volume growth – percentage change on a year earlier
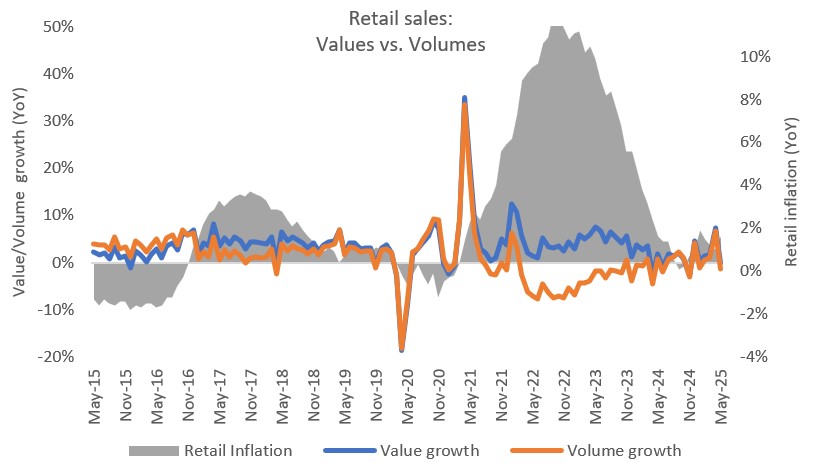
Source: ONS, Retail Economics analysis
Note: all retail sales figures provided below are non-seasonally adjusted, excluding Fuel, unless stated otherwise.
Food and non-food
- Food sales values dipped 0.3% YoY in May. This compares to a 1.2% rise a year earlier. Adjusting for inflation, volumes plunged 3.5% against a decline of 1.2%.
- Non-food sales values and volumes both edged up 0.9% in May, following April’s uplift. • Clothing sales values declined 2.2% on last year in May, while volumes dropped 2.5%. Meanwhile, Footwear and Leather Goods volumes slipped 4.9%.
- Household Goods volumes increased by 3.7% YoY, driven by an 15.5% jump in Electrical Household Appliances – marking a second consecutive month of double-digit rises.
- Pharmaceuticals, Cosmetics and Toiletries volumes plunged 7.4% in May, having been in decline since the start of this year.
Online
- Online sales values declined by 2.5% YoY in May, against a 5.6% increase a year earlier.
- Clothing & Footwear declined 7.6%, marking its first decline since January, while Household Goods decreased by 8.7%.
- Non-store retailing (a proxy for pureplay retailers) slipped into decline as sales fell by 2.5% YoY in the month, against a 7.6% increase a year earlier.
- The proportion of retail sales made online was 26.0% in May, compared to 26.6% a year earlier.
- Overall, average weekly online sales edged up to £2.35bn in May.
Retail sales price deflator
- The retail sales deflator (a measure of inflation specific to retail) rose by 1.2% excluding fuel, but was broadly flat when including fuel.
- The implied price deflator among food rose to its highest level since April last year at 3.2%. Among non-food stores, the price deflator was broadly flat in May at 0.1%.
Back to Retail Economic News