ONS Retail Sales July 2026
- Retail sales (value, non-seasonally adjusted, exc. fuel) grew by 3.8% year-on-year (YoY) in July according to the latest ONS data. It compares to a 3.4% uplift a year earlier.
- In volume terms (non-seasonally adjusted, exc. fuel), retail sales grew by 2.2% YoY in July. It compares to a 1.5% uplift a year ago.
- It should be noted that ONS figures are based on a sample of some 5,000 retailers and are subject to revisions.
Retail sales value and volume growth – percentage change on a year earlier
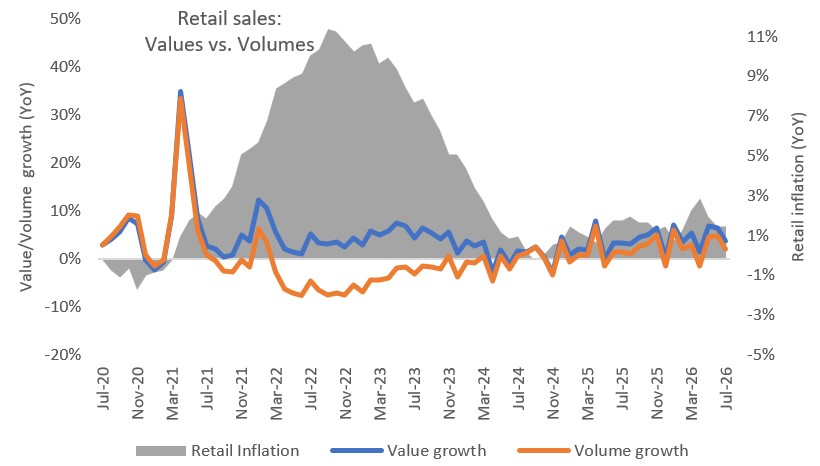
Source: ONS, Retail Economics analysis
Note: all retail sales figures provided below are non-seasonally adjusted, excluding Fuel, unless stated otherwise.
Food and non-food
- Food sales values rose by 1.5% YoY in July, against a 4.8% uplift a year earlier. Adjusting for inflation, food sales volumes slipped by 0.4%.
- Non-food sales values rose by 4.7% in July, while volumes increased 3.5%, despite sales easing from June as earlier promotions brought demand forward.
- Clothing sales values softened to a 2.2% YoY rise. Clothing volumes increased by 1.2%, while Footwear and Leather fell 8.4%.
- Household Goods volumes rose 3.3% YoY in July, with Furniture and Lighting up 9.1%. Elsewhere, Computers and Telecoms jumped 43.6% following a decline a year earlier.
- Pharmaceuticals, Cosmetics and Toiletries volumes remained another standout, rising 15.7% in July – its fourth month of double-digit increases.
Online
- Online sales values grew by 6.5% YoY in July, against a 2.7% uplift in the previous year.
- Clothing & Footwear rose by 4.3% YoY and Household Goods increased 17.0% in July.
- Non-store retailing (a proxy for pureplay retailers) rose 7.7% YoY in the month, against a 2.0% uplift a year earlier.
- The proportion of retail sales made online rose to 27.4% in July, compared to 26.7% a year earlier, but eased from 28.2% in June.
- Overall, average weekly online sales reached £2.6bn in July.
Retail sales price deflator
- The retail sales deflator (a measure of inflation specific to retail) rose by 1.6% excluding fuel, and 2.7% including fuel.
- The implied price deflator among food eased to 1.9% – its lowest rate since December 2024. Among non-food stores, the price deflator edged up to 1.2% in July.
Back to Retail Economic News