Retail sales remain robust: Home and Fashion best performing categories
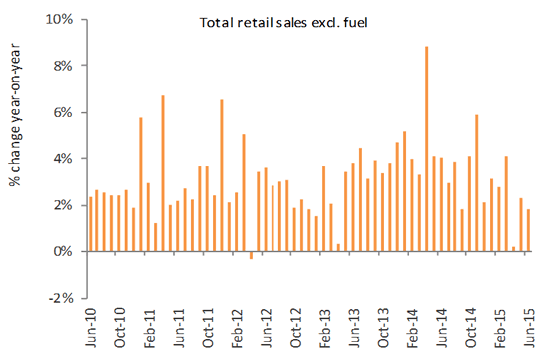
Retail sales values (non-seasonally adjusted values and excluding fuel) rose by 1.8 per cent in June, according to the Office for National Statistics (ONS). In volume terms, growth continued for the 27th consecutive month and rose by 4.0 per cent year-on-year. The three month on three month metric, which gives a better indication of the underlying strength of sales, rose by 0.7 per cent which marks the longest period of sustained growth since records began in June 1997.

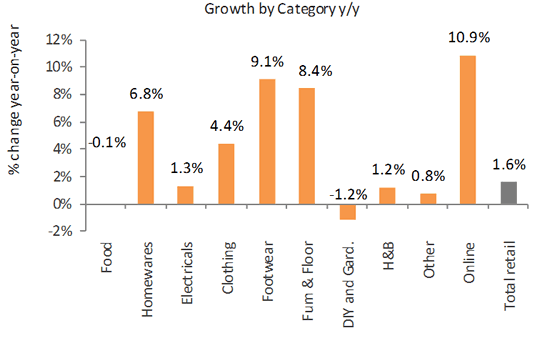
Source: ONSONS estimated that online sales rose by 11.4 per cent year-on-year and accounted for 12.4 per cent of total retail sales in June. The equivalent measure from the BRC-KPMG Retail Sales Monitor (total retail sales values) showed growth of 2.9 per cent in June – the strongest since January 2014, excluding Easter distortions. The likely cause for the difference in sales growth is the performance of small retailers which are generally not covered in the BRC measure. The ONS suggests that small retailers delivered growth of 0.3 per cent in June, compared with 2.4 per cent for large retailers which dragged down top line growth. Another source of difference lies in the performance of Food. The BRC recorded a rise in Food sales whereas the ONS suggested zero growth. Retail Economics estimates that total retail sales rose by 1.6 per cent in June, held back by the continued underperformance of the Food sector. Intense competition from the discounters (Aldi and Lidl) and rapidly changing consumer habits have kept prices from rising which are holding back any top line growth. We believe that growth in the Food sector will remain hard-fought as changing structural dynamics will force retailers to focus on price. The performance of Food and Non-food will become increasingly polarised over the next 6-12 months. Household’s positive backdrop of low inflation, rising real wages, near record levels of employment and buoyant consumer confidence will boost the Non-food sectors but is unlikely to benefit Food to the same degree. Stronger performance in the housing market through rising mortgage approvals – up 8 per cent in June according to the British Bankers’ Association – helped keep activity high in the Home category. Homewares (+6.8 per cent) and Furniture and Flooring (+8.4 per cent) had another strong month in June, building on 12 months of strong underlying demand. The number of home loans for house purchases hit a 15-month high which is likely to provide further support for this category in the coming months.

Source: Retail Economics IndexClothing (+4.4 per cent) and Footwear (+9.1 per cent) were the other stand-out categories which benefitted from warmer weather in June. Although growth was marginally down on the previous month, the underlying trend remains strong for Fashion. Those retailers providing a seamless omnichannel proposition continue to drive sales from increasingly digitally-focused consumers. In June, Clothing and Footwear were in the top three growth categories in online non-food sales according to the BRC. Estimates suggest 24.9 per cent of total Clothing sales were from online, up from 21.4 per cent this time last year. The penetration of online in footwear is estimated to be even higher at 27.6 per cent in June, up from 23.6 per cent last year. However, many retailers were in the Summer Sales period which suggests margins were eroded over this period.
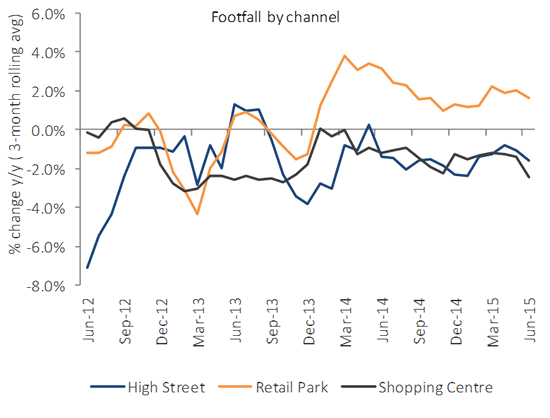
FootfallThe latest data from Springboard suggests that total footfall was down 0.8 per cent in June, year-on-year. High Streets performed the worst with footfall estimated to decline by 2.8 per cent year-on-year. Shopping Centres did not fare much better with a decline of 2.4 per cent, continuing the overall trend of declining visitor numbers in traditional shopping locations. Retail Parks saw growth of 2.8 per cent year-on-year, the 18th consecutive month of positive growth. Using a three-month rolling average, to smooth out volatility, suggest that retail parks continue to outperform all other physical channels of retailing. We believe that the reinvention of many retail parks to bring a greater mix of leisure and experiences in addition to retail is driving footfall to these locations. Non-food retailers, such as Home and Leisure which typically have a higher exposure to retail parks, are continuing to benefit from high levels of footfall through this channel.

Source: SpringboardHowever, there is growing evidence that the consumer recovery is benefiting non-retail components the most. Just one third of consumer spending goes through retail and the growth of Recreation and Culture and Transport (including new and second hand cars) is critical to retail spend. (For more information please see “Consumer Spending Report: Q2 2015”)
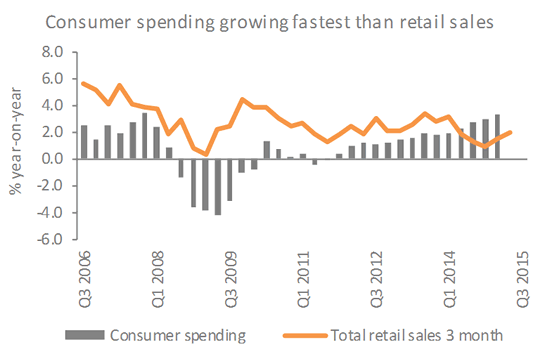
Consumer spendingRetailers do not appear to have benefitted to the same extent as other parts of consumer spending over the last 12 months. A comparison of consumer spending growth against total retail sales growth, as measured by the BRC-KPMG Retail Sales Monitor, reveals that for the first time in over 10 years, consumer spending is consistently outpacing retail sales. This recent trend has posed us with some interesting questions – why has the retail sector not benefitted as much as other parts of consumer spending?Understanding the differences in sales measures is very important. So while we feel that the BRC’s measure is likely to represent a more accurate representation of the health of the retail sector than the ONS measure, the sample is much smaller and it doesn’t pick up the performance of small retailers.

Source: ONS, BRC, Retail Economics analysisA direct comparison of the extent to which growth rates between the ONS and BRC have differed reveals that over the last over the last 12-18 months the gap appears to have grown.One possible explanation of the difference could be attributed to the performance of small retailers. The BRC’s measure consists of sales from around 60 large retailers whereas the ONS measure includes c. 5,000 retailers, the majority of which are small retailers. While we feel confident that the BRC measure is a more accurate indication of the performance of large high street retailers, it does not account for the performance of smaller retailers. Is it possible that smaller retailers in the UK are doing that well? Other survey evidence suggests that there has been a revival in independents on UK high streets. The Local Data Company recently claimed that independent shops are growing at their fastest rate in years with a net increase in the number of stores. Higher vacancy rates on high streets (10.2 per cent in April 2015 according to the BRC and Springboard) has led to cheaper rents and with the continued support from Small Business Rates Relief – it’s becoming commercially viable to open small operations, especially when they are combined with a healthy online offering. The combination of a revival of independents and a move from consumers towards marketplaces such as eBay and Amazon (which give may small retailers a vital route to market) could explain the underperformance of large retailers in the UK market, in the context of strong consumer spending numbers.
Back to Retail Economic News