Retail Economics Response - ONS Labour Market August 2016
Overall, this latest report showed continued strength in the labour market with firms continuing to hire ahead of the EU referendum and in the immediate aftermath. So overall, business as usual although there are clear risks that this could be the calm before the storm.Granted, wage growth has showed signs of weakness in these latest figures. However, it is too early to blame Brexit on the lack of wage growth given it lags movements in the market by a sizeable margin. It won’t be until next month when we’ll get clearer visibility on any potential impact from Brexit on firms’ hiring activity.Nevertheless, the latest data showed unemployment remained at 4.9 per cent in the three months to July, down from 5.5 per cent this time last year. Meanwhile, average earnings growth slowed marginally on previous levels rising by 2.3 per cent (including bonuses). The measure which excluded bonuses rose by 2.1 per cent. This is also against a backdrop of the introduction of the National Living Wage on 1 April 2016.According to ONS, Retail wages rose by 2.9 per cent in July which is down on June’s 3.5 per cent (excluding bonuses) and remains significantly weaker than an average rise of 6.4 per cent for the whole of 2015. It suggests that the introduction of the National Living Wage had little impact on the overall sector.There were 31.77 million people in work, 174,000 more than for February to April 2016 and 559,000 more than for a year earlier. There were 23.25 million people working full-time, 434,000 more than for a year earlier. There were 8.51 million people working part-time, 126,000 more than for a year earlier. The employment rate (the proportion of people aged from 16 to 64 who were in work) was 74.5 per cent, the joint highest since comparable records began in 1971.
Figure 1 – UK employment rate, seasonally adjusted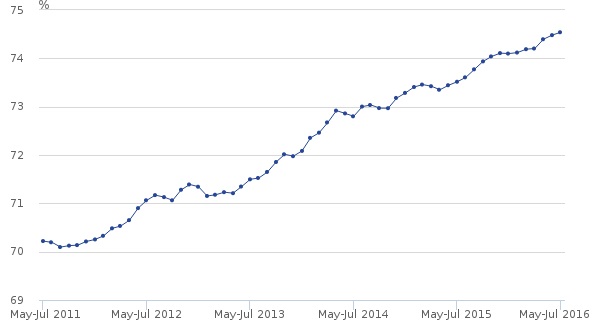
Source: ONSFor May to July 2016, 74.5 per cent of people aged from 16 to 64 were in work, the joint highest since comparable records began in 1971.
Figure 2 – Total hours worked and number of people in work in the UK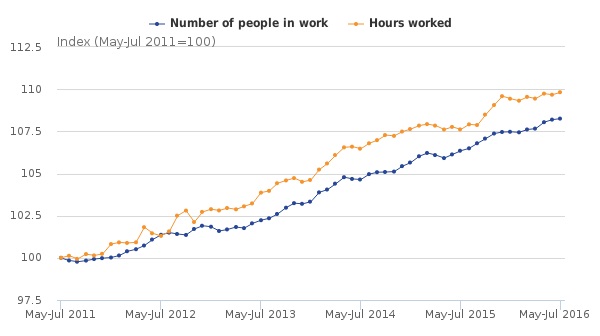
Source: ONS Actual hours worked measures the number of hours worked in the economy. Changes in actual hours worked reflect changes in the number of people in employment and the average hours worked by those people.Total hours worked per week were 1.02 billion for May to July 2016. This was:- 3.5 million (0.3 per cent) more than for February to April 2016- 20.5 million (2.0 per cent) more than for a year earlier
Back to Retail Economic News