UK Online Retail Sales Report summary
December 2020
Period covered: Period covered: 01 Nov 2020 – 28 Nov 2020
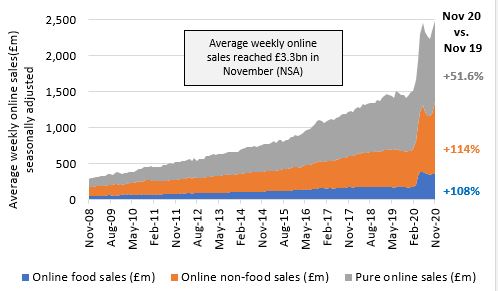
Online Retail Sales rose by 79.6% in November, value and non-seasonally adjusted, year-on-year, according to ONS. Retail sales rose by 2.3% in November, year-on-year, according to Retail Economics. Average weekly online sales were £3,251m in November, according to ONS. Online accounted for 36.0% of total retail sales in November, value and non-seasonally adjusted, according to ONS. Online Clothing & Footwear rose by 52.4% in November, year-on-year, according to ONS.
UK Online Retail Overview
Online retail sales rose by 79.6% year-on-year (value and non-seasonally adjusted) in November, against a 0.4% decline in the same month a year ago – the strongest rise on record. Growth outperformed the three-month and 12-month averages.
ONS Online Retail Sales
Online sales growth rose by 79.6% in November year-on-year, (value, non-seasonally adjusted), against a 0.4% fall a year ago - a new record high. Resultantly, sales growth outperformed the three-month and 12- month averages of 64.3% and 42.2% respectively. Sales growth was distorted by the 53-week trading period this year compared with 52 weeks in 2019.
BRC Online Retail Sales
Online non-food sales growth accelerated by 47.2% in November, year-on-year, against 0.3% growth a year earlier, according to the BRC-KPMG Retail Sales Monitor. The BRC estimates that in the three months to November, Online Non-Food sales rose by 40.6%, while in-store sales fell by 18.6% on a total basis. Other Non-Food, Home Accessories and Health & Beauty were the standout performers while Toys & Baby Equipment fell to the bottom of the rankings.
BDO Non-Store Retail Sales
Total non-store LFLs rose by 106.3% in November (five weeks to 29 November) year-on-year, against a 2.8% rise a year earlier – improving on the previous month. By comparison in-store LFLs nosedived 53.1% year-on-year against a decline of 1.8% a year earlier. Sales growth was strongest in weeks three and four of the month which recorded growth of 142.4% and 152.2% respectively.
IMRG Capgemini e-Retail Sales Index
The IMRG-Capgemini e-Retail Sales Index reported online sales growth rose by 39.0% year-on-year, in November – the strongest November rise in 13 years. On a month-on-month basis, sales growth rose by 58.0%. Sales growth was strongest in the first week of the month rising by 61% year-on-year.
Office for National Statistics
Online food sales growth accelerated in November, rising by 107.8% year-on-year, compared with a 1.3% fall in the same month a year ago. This was the fourth month this year to record sales growth of over 100%. Resultantly, sales growth outperformed the three-month and 12- month averages of 99.6% and 71.5% respectively. The category was supported by a transference of spending from hospitality to eating in, with the hospitality sector closed (except for takeaways and delivery).
Online Non-Food sales rose by 113.7% in November year-on-year, against a weak comparison a year ago when sales fell by 5.6% - a record high. Sales growth outperformed the three-month and 12-month averages of 79.9% and 47.1%. Within the Non-Food category, Household Goods (+163.7%) and Department Stores (+151.6%) were the strongest performers, closely followed by Other Non-Food (+132.8%).
Online Clothing & Footwear sales growth accelerated in November, rising by 52.4% year-on-year, against a 1.1% fall in the same month a year ago – a new record high. The improved performance was driven by a combination of stores being closed throughout the month, weak comparisons a year ago due to the timing of Black Friday as well as a longer promotional period during the sales event.
Online Household Goods sales growth rose by 163.7% in November, year-on-year against a 9.4% decline a year earlier which was distorted by the timing of Black Friday. Hence, sales growth outperformed the three-month and 12- month averages of 97.6% and 73.3% respectively. Online sales of Household Goods accounted for 34.9% of total retail sales in November.
Online Department Stores sales growth rose by 87.2% in October, year-on-year, against a 4.1% rise a year ago - broadly unchanged on the previous month. Sales growth outperformed both the three and 12-month averages of 79.5% and 40.9% respectively. Online sales accounted for 28.0% of total Department Stores sales in October.
Online Department Stores sales growth rose by 151.6% in November, year-on-year, a new record high, albeit against a weak comparison a year ago when sales growth declined 17.1% due to Black Friday distortions. Sales growth outperformed both the three and 12-month averages of 109.3% and 55.1% respectively. Online sales accounted for 40.5% of total Department Stores sales in November.
Online sales within the Other Non-Food category (which includes Jewellery, Gardening, Health & Beauty, and some Electricals) rose by 132.8% year-on-year in November, against a weak comparison a year ago when sales growth rose by 3.7% - a new record high. This significant improvement resulted in sales growth remaining above the three-month and 12-month averages of 105.0% and 67.5% respectively.
The second lockdown has boosted online sales and is likely to further entrench buying behaviour
 Source: Source: ONS, Retail Economics analysis